Some new numbers make two important points about social media giant Facebook: Facebook apps are driving user engagement, and mobile is driving Facebook.
A new report from telecom analytics firm Mobidia, in partnership with ABI Research, looked at data from millions of smartphone users and found that while social and chat applications dominated, Facebook’s apps (including its core app, Messenger, Instagram and WhatsApp) drove the highest levels of engagement globally. The data set came from users in countries including the U.S., U.K., China, Japan, South Korea, Singapore, Germany and Malaysia.
You can download the white paper from Mobidia and ABI here, but the highlights included:
–Facebook’s main app “consistently experiences the highest monthly utilization results in all major markets (excluding South Korea, Japan and Germany), with over 50 percent of users analyzed engaging with the app every month.”
–Facebook had the most monthly usage of all apps in the U.S., among the analyzed users: 68% utilized Facebook, averaging 24 minutes a day and 730 minutes per month.
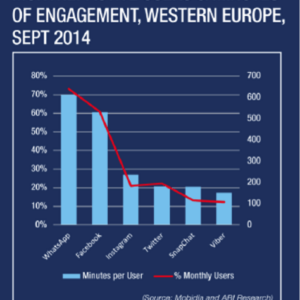
–Facebook’s mobile app engaged 60% of users, averaging 500 minutes per month. Instagram followed with an engagement rate of 20% of analyzed users who used the app an average of 300 minutes each month.
— WhatsApp took precedence in Western Europe. Among analyzed users, 73% used WhatsApp, and averaged 20 minutes a day and 612 minutes each month.

Mobile users make up a huge majority of Facebook’s users and according to Venturebeat, account for most of its revenue. Out of the site’s 1.35 billion monthly active users (MAUs) reached during the third quarter of 2014, 83% were mobile. And the mobile MAU segment grew more than twice as fast as Facebook’s overall user growth: 29% year-over-year, compared to an overall MAU growth rate of 14%. In fact, the fastest growing segment of MAUs were mobile-only users, up 80% from last year to 456 million.

BI Intelligence noted recently that a majority of Facebook’s ad revenue comes from mobile as well (chart here).
Image Copyright: bloomua / 123RF Stock Photo

