Compass Intelligence breaks down Q4 and 2015 results for mobile carriers
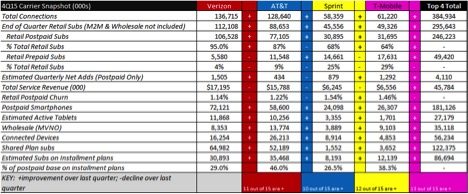
Compass Intelligence just completed the final assessment of fourth quarter and end-of-year metrics with the domestic market’s major wireless carriers. We do this each quarter to understand the subscriber and share changes, as well as evaluate the key trends taking place in the wireless industry for both consumer and enterprise customers. We have been tracking the quarterly metrics since 2007. Some metrics are our own internal modeling and estimates as the market does not report in all categories. Compass Intelligence also does this for the entire “Internet of Things” and machine-to-machine space as well. A snapshot of Q4 2016 is below.
Compass Intelligence compared last quarter’s results to this quarter to show which metrics showed improvement over others (denoted by + or -).

Source: Compass Intelligence, Carrier Earnings Reports
Overall market
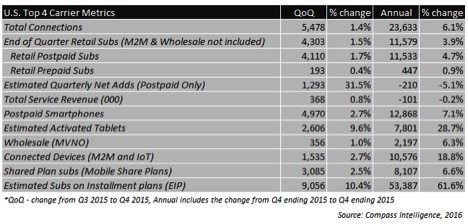
• The market ended the quarter with about 5.5 million new connections quarter-over-quarter (includes IoT and mobile subscribers), but added 23.6 million connections for the entire year, growing at 6.1%.
• Smartphone growth is continuing to slow overall, but from Q3 to Q4 an estimated 5 million postpaid smartphones were added for the quarter and 12.9 million for the year (7.1% annual growth).
• Tablet activations show growth for the quarter at 9.6% or 2.6 million additions, and 7.8 million added for the year with overall growth at 28.7%.
• Verizon Wireless and AT&T Mobility continue to push their customers towards installment plans and are showing growth in terms of their overall base on EIP (AT&T Mobility leading with 46% of base).
• Sprint halted two-year contracts for a brief period, but reinstated over the last week, mentioning customers drove their decision.
Revenue
• All carriers reported lower service revenue except for T-Mobile US, which was the only carrier to experience revenue growth from Q3 to Q4.
• For 2015, overall revenues remained very flat with an overall 0.2% decline from 2014.
Churn
• Verizon Wireless experienced the lowest churn for the quarter with 1.14% churn, while Sprint continues to post the highest churn rates despite improving metrics overall for the quarter.
Postpaid adds
• All four carriers ended the quarter with positive postpaid net adds, posting 4.3 million retail net subscriber additions for the year, or 1.5% growth.
• While last quarter T-Mobile US dominated with postpaid adds, this quarter Verizon Wireless came out on top posting 1.5 million net customer additions.
• For the year, T-Mobile US came out on top with 5.8 million postpaid net additions, followed by Verizon Wireless with 3.9 million net adds for the year.
Connections
• Total industry connections at year-end totaled 401 million.
• Total industry subscriber base at year-end totaled 343 million, including all mobile network operators and mobile virtual network operators.
• Smartphone subscribers totaled 240 million at the end of 2015, with about 70% of total subs carrying smartphones.
• Postpaid smartphone connections for big four carriers reached 181 million.

As shown above, overall the industry added an estimated 24 million connections in 2015, which represents a 6.1% change from 2014. AT&T Mobility lead overall connection adds for the year, adding more than 8 million connections in 2015, followed by T-Mobile US with approximately 6 million added connections. AT&T Mobility’s growth was primarily driven by IoT connections, specific to growth in the connected car deals it closed in 2015. In terms of retail subscribers, the industry growth for the year reached 3.9%, adding 11.6 million subscribers. For retail subscribers, T-Mobile US was the strongest performer adding 5.8 million retail subscribers in 2015, followed by Verizon Wireless with 3.9 million retail subscribers last year.
Editor’s Note: Welcome to Analyst Angle. We’ve collected a group of the industry’s leading analysts to give their outlook on the hot topics in the wireless industry.

