T-Mobile US attracts the most customers in 2016, while Verizon excelled in retail churn.
Editor’s Note: Welcome to Analyst Angle. We’ve collected a group of the industry’s leading analysts to give their outlook on the hot topics in the wireless industry.
All four nationwide carriers have finished up their earnings calls, and Compass Intelligence just completed the final assessment of fourth quarter and full year 2016 performance, and also evaluated the comparisons to previous quarters and 2015 in terms of performance. We do this each quarter to understand the subscriber and share changes, as well as evaluate the key trends taking place in the wireless industry for both consumer and enterprise segments.
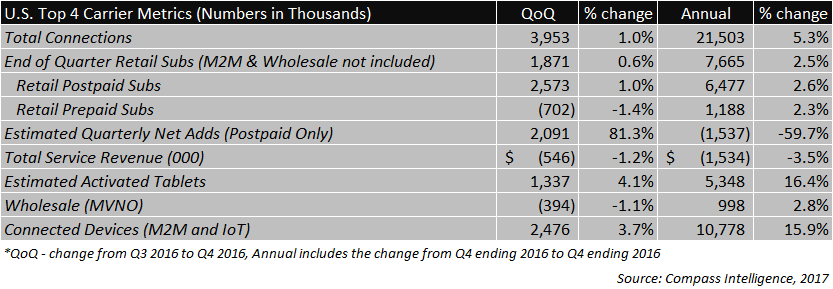
We have been tracking the quarterly metrics since 2007. Some metrics are our own internal modeling and estimates, as the market does not report in all categories. A snapshot of Q4 2016 is below.

Compass Intelligence compared Q4 2015 and 2016 results to highlight which metrics showed improvement over others (denoted by + or -).
Below are additional thoughts and insights based on the quarter and annual performance.
Summary
• Q1 2016 experienced the most connection additions for the year, while Q4 (a quarter that usually experiences decent growth due to holiday sales) added the fewest total connections compared to all 4 quarters.
• Q4 2016 included about 4 million new connections (including connected devices and mobile subscribers), which is about 1.2 million less than what was added in Q3 2016.
• Retail subscribers for the top four carriers reached 303.3 million, or 7.7 million additions for the year.
• While Verizon Wireless maintained the lowest churn for the year at an average of .985%, AT&T Mobility followed with an average churn at 1.08%
• A total of 5.3 million tablets were activated for the year, with Verizon Wireless adding 507,000 tablets in Q4 alone.
• Based on total connections alone, only T-Mobile US gained market share. Verizon Wireless lost almost 1% market share, while T-Mobile US gained more than 1% share.
• AT&T Mobility leveraged its internet of things growth in 2016, and remained the market leader in IoT connections.
Revenue
• Similar to Q3 2016, only T-Mobile US reported a sequential increase in service revenues.
• T-Mobile US posted a $122 million increase in service revenue in Q4 compared to Q3 2016.
• Combined, the industry experienced a $546 million increase in wireless service revenue in 2016.
• Total Q4 2016 mobile service revenue reached $44.3 billion, compared to $44.8 billion in Q3 2016.
Postpaid adds
• All four carriers ended the quarter with positive postpaid net additions, with 2.6 million retail subscribers added in the quarter.
• T-Mobile US dominated Q4 postpaid adds, being the only carrier to add more than 1 million postpaid connections, which the carrier also accomplished in Q3.
• Verizon Wireless added 576,000 postpaid subscribers in Q4 2016, which was an improvement from Q3 2016.
Connections
• Total connections for the four largest carriers reached 406.4 million at the end of Q4 2016.
• Total industry subscriber base hit 418.5 million, including all mobile network operators and mobile virtual network operators.
• Total smartphone subscribers hit 313.5 million at the end of 2016.
• Total connected devices reached 67.8 million for the industry.

As shown above, the industry added an estimated 21.5 million connections in 2016, compared to 24 million connections in 2015, which represents a 5.3% year-over-year decline. While Verizon Wireless ended the year with the most connections (140.6 million), T-Mobile US lead overall connection growth for the year, adding more than 10.2 million connections. In 2015, AT&T Mobility was the leader in overall connection growth. For 2016, AT&T Mobility’s growth was primarily driven by IoT connections, adding an estimated 5.4 million connected device connections during the year.
In terms of retail subscribers, the industry growth for the year reached 2.5%, adding 7.7 million subscribers. For retail subscribers, T-Mobile US was the strongest performer adding 4.9 million retail subscribers in 2016, followed by AT&T Mobility with 2.7 million retail subscriber additions in 2016.

