Testing of 5G at sub-6 GHz frequencies concludes that mid-band LTE is “the weakest link”
Even with low-band 5G New Radio deployments that would presumably provide more, and more robust, coverage than millimeter-waved-based 5G, carriers’ 5G coverage maps are still “optimistic,” according to new drive test data from Signals Research Group. And that fancy 5G signal indicator on a new smartphone? It’s not particularly accurate in indicating that the phone is actually connected to a 5G network.
In a new report, SRG details the results of drive-testing 5G New Radio in FDD and sub-6 GHz frequencies, exploring 5G deployments by AT&T and T-Mobile US in Indianapolis, Indiana and San Diego, California. The testing included smartphones from each carrier as well as the use of a Rohde & Schwarz scanner to determine the extent of 5G coverage, whether the smartphone connected to the network or not.
SRG’s report highlights some of the limitations of NonStandalone 5G.
“Although low-band 5G NR signals may propagate for miles and miles, they still need LTE for an anchor with NSA,” the report noted, going on to add that “Since a smartphone can’t support two low-band frequencies, it means it must use a mid-band LTE frequency for the anchor carrier with 5G NR. Put simply, an operator’s low-band 5G NR coverage is only as good as the propagation of a mid-band LTE frequency.”
“Moving to a Standalone (SA) architecture is one way to address the issue,” SRG pointed out.
5G NSA also plays into the discrepancy between when a 5G signal indicator is displayed and when the device is actually connected to 5G. As SRG said in its report, there are “stark differences between the smartphone having an actual 5G NR connection and what the phone displays. … The 5G icon is a poor
indicator of a 5G connection.”
“The LTE cell that provides the anchor for 5G NR (NSA) is used to trigger the phone’s display of the
5G icon while the LTE cell’s signal strength [and not the 5G NR cell] helps the phone determine
how many bars to display,” SRG explained. “The challenge is that the LTE cell and the 5G NR cell are not necessarily co-located, so it is very possible to be within range of the LTE anchor cell but outside the range of the 5G NR cell.” The company went on to add that while its understanding is that “an AT&T 5G NR smartphone should only display a 5G icon when the LTE and 5G NR cells are collocated,” it’s also possible to have a 5G NR connection while the phone is displaying LTE or 5GE.
SRG said that on a T-Mobile device, the 5G icon is “almost always on, even if the scanner indicates all 5G NR signals are too low to support a connection.” An AT&T smartphone did a better job of accurately indicating a 5G connection, SRG said, but added that even so, the 5G icon popped up while testing License-Assisted Access in downtown Indianapolis where there wasn’t any 5G NR available.
The vagaries of the 5G icon could impact customers’ perception of the value of 5G and 5G smartphones.
“It is a bit frustrating to see both smartphones showing a sustained 5G icon with full bars while parked when neither phone is connected to 5G NR and the top 5G NR cell barely registers on the scanner (-135 dBm). Since we used loaner phones and we were using test SIMs to supported unlimited data, we don’t have any skin in the game,” SRG said. “However, we surmise that consumers could respond quite differently to misleading information about 5G NR availability after shelling out close to $1,500 for a new smartphone.”
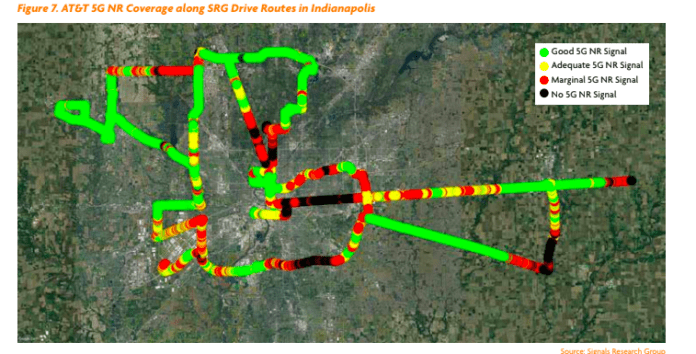
In terms of coverage, SRG used the Rohde & Schwarz scanner to map out potential 5G NR coverage areas in both cities.
“Although coverage is quite good and 5G NR is available in some very unlikely places, the maps overstate where the 5G NR signal is strong enough to support a good data connection,” the company said, concluding that “5G coverage maps are optimistic.”
In all, SRG covered a drive test route of more than 350 kilometers in each of the two cities, using a Rohde & Schwarz TSME6 scanner as well as Accuver Americas’ XCAL-M solution to log chipset data from the smartphones and capture log data; SRG used Spirent Communications’ Umetrix Data tool to generate sustained high-bandwidth HTTP data transfers.
5G NR coverage was generally better in Indianapolis, which has less complicated terrain that San Diego. SRG found that overall, based on the scanner data (not smartphone performance), T-Mobile’s 5G NR coverage was better than AT&T’s 5G NR coverage in both markets, although the difference was “very modest” in San Diego. However, 5G NR performance in the low band doesn’t necessarily beat out good old LTE. When testing on Coronado Island, for instance, LTE throughput on AT&T’s network achieved almost 450 Mbps, which was more than twice the observed speeds on T-Mobile US’ 5G network in the same place.
Read more details in Signals Research Group’s latest Signals Flash!.

