In 2020, the global gaming market was valued at $162.32 billion and is expected to reach $295.63 billion by 2026, largely driven by cloud gaming and mobile gaming on smart phones. The emergence of E-sports, for example, in which gamers compete for millions of dollars in prize money, has been growing in popularity over the past few years and is one of the few sports that has been immune to the COVID-19 pandemic. As new 5G network infrastructure is deployed around the world, gaming will continue to be propelled to new heights. One of the key advantages of 5G lies in its flexibility, where it can create scalable network slices that support the individual transport requirements for critical and less critical applications. These network slices can be “tuned” for extremely short latencies, ensuring reliable connections and peak transport rates. And for professional gamers, network latencies (or “lag time”) can make the difference between winning and losing.
The interactivity of a network can be defined as the measurable continuity and latency for a given bit rate, or even the entire setup, including backbone and far-end server or device. Interactivity testing is specifically designed to measure very short latencies, included in ultra reliable low latency communications (URLLC) on realistically shaped network traffic.
Network Challenges
Today’s applications and use cases work with today’s network capabilities. They require a certain throughput, but they can cope with temporary low bit rates or interruptions due to buffering data. The fact that today’s networks and technologies are not able to transport data with ultra-high reliability and very short latencies limits users to more download-oriented services and away from seamless real-time applications. This will and must change with the deployment of 5G.
5G is prepared to be a technology for more than humans using smartphones, outdated paging and modem services. 5G is intended to be the digital transport backbone for use cases such as mobile real-time eGaming. Considering that data throughput is not the only key parameter for new, interactive gaming applications and real-time control services, the underlying key network parameters are as follows:
– Transport capacity (bit rate)
– Transport latency
– Transport continuity

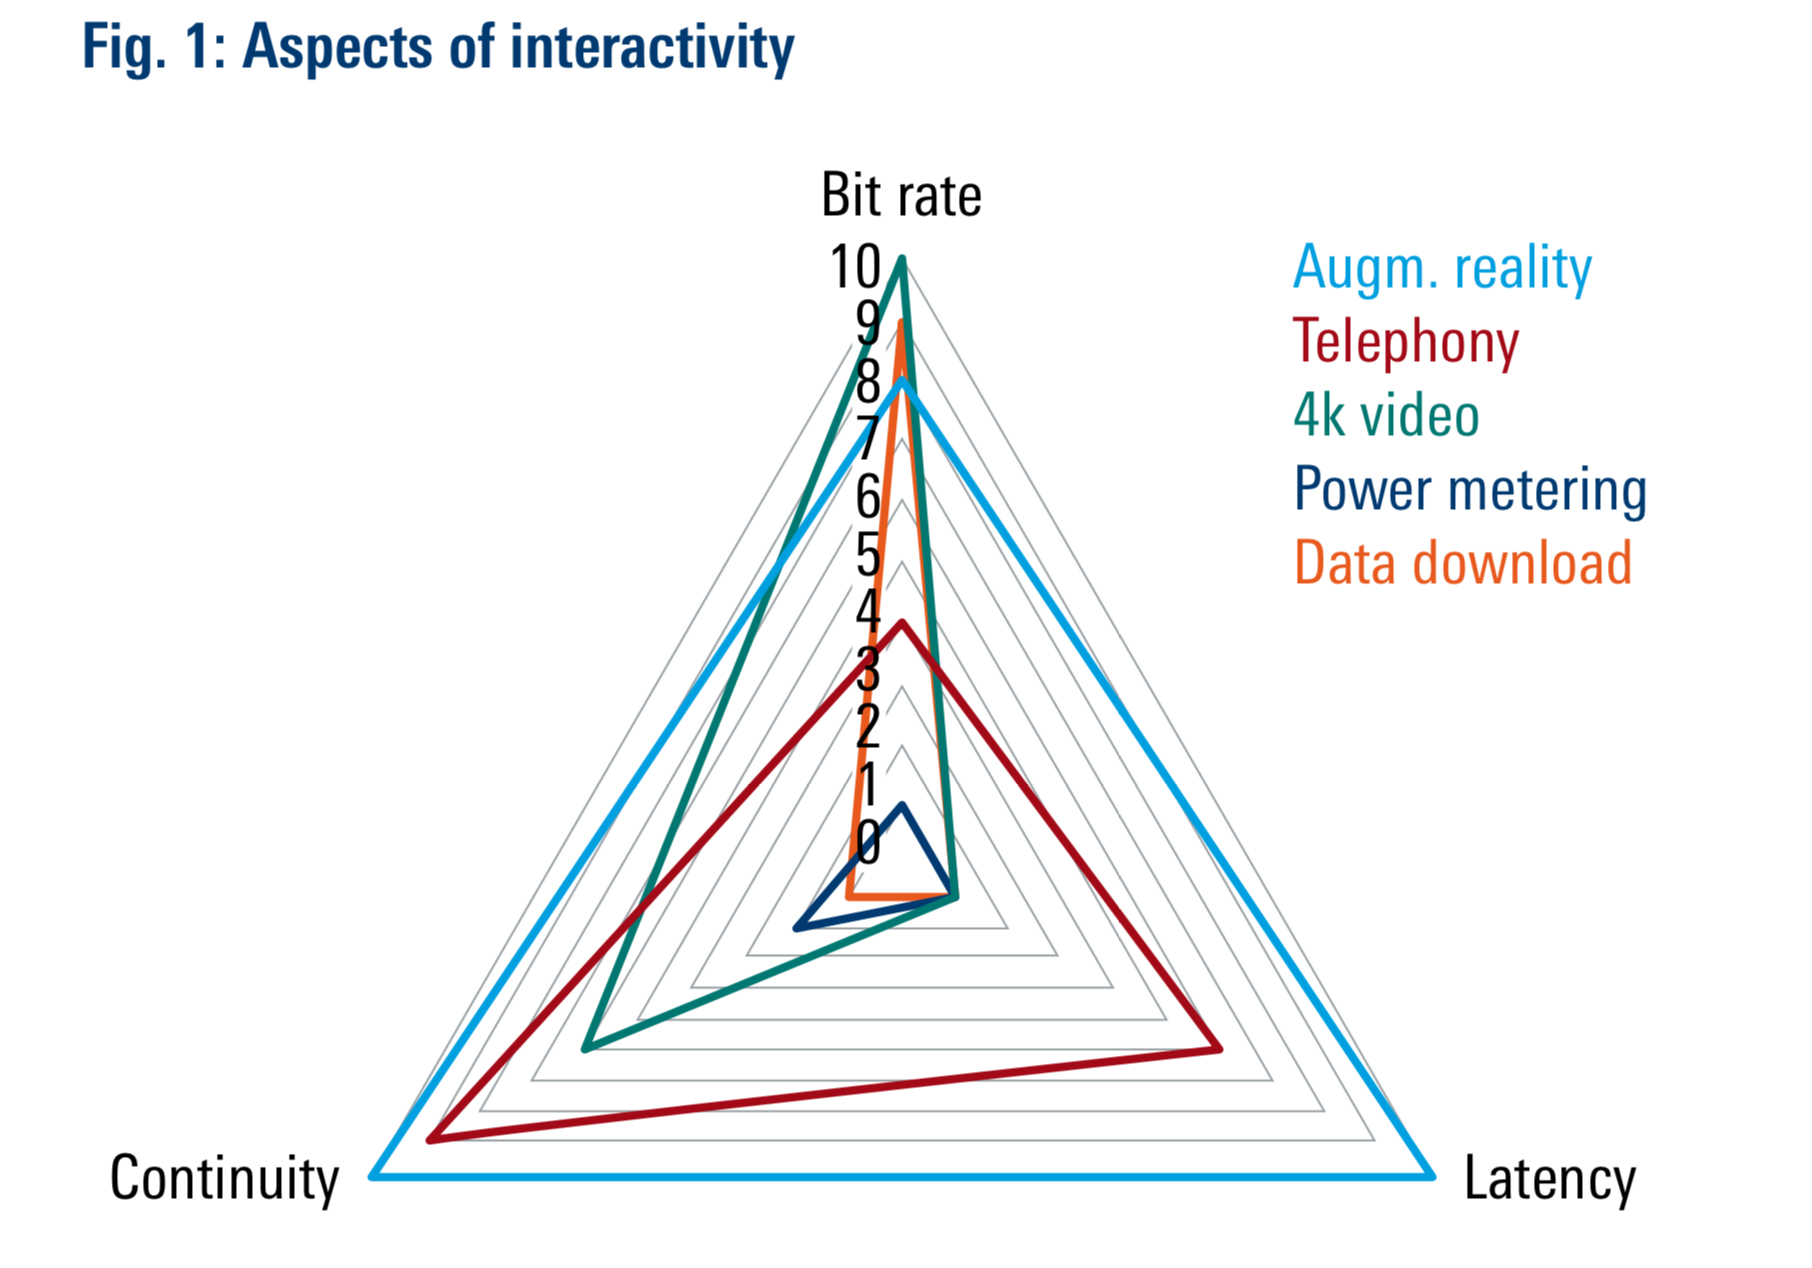
Figure 1 shows the interaction of these three key network parameters. Different types of applications and use cases will have different requirements in these three dimensions. A data download such as updating maps mainly requires a high bit rate. For telephony and/or real-time surveillance, the focus is on continuity. For real-time interaction such as augmented reality (AR), the requirements are high in all dimensions.
QoS/QoE Measurement in 5G
With evolving network capabilities, some significant changes need to be made in measuring a network’s Quality of Service (QoS), in terms of guaranteeing dependably run applications and traffic, and Quality of Experience (QoE), in terms of the consumer’s experience with the service.
The fundamental concept of QoE remains the same, even if the importance for the user and the acceptability thresholds change:
– Accessibility and sustainability: Do I have access to the service at all and is the connection technically maintained?
– Waiting time for action (task is started and/or completed): How long does the access take?
– Quality: How is the experience during active use?
In 5G, accessibility and sustainability will be a given. The very rare fails will be more annoying to the affected user than they are today, but they will be so rare that they will have a low impact on the overall QoE. The same applies to access and waiting times; they will become very short and have little influence on the QoE. The key challenge is to measure experience during the active use of an application such as eGaming:
– How is the perceived quality (e.g., video quality)?
– How is the response time to an action or an instruction?
– How fluent is the service? Are there interruptions or undercuts? Is the other end temporarily unavailable?
Interactivity Testing
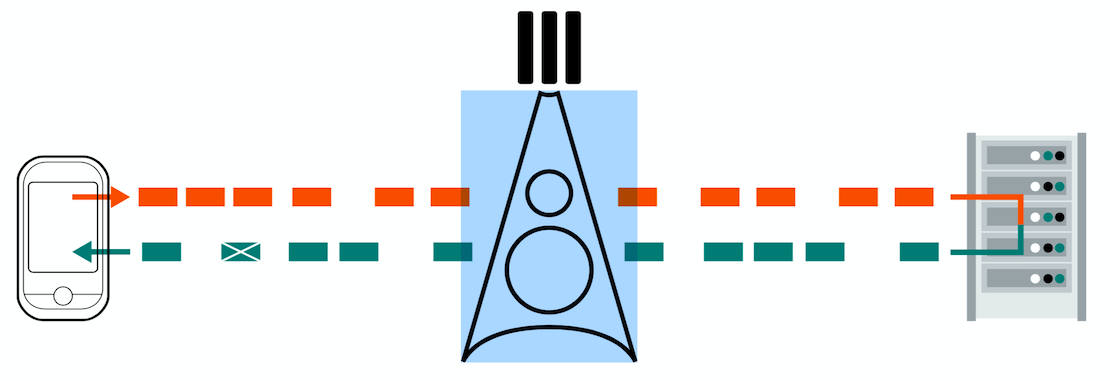
The interactivity test measures bit rate, latency and continuity at the same time. User equipment (UE) acts as a client that sends a stream of packets to an active remote station, for example, server or partner UE, which acts as the responder and reflects the packets to the UE.

The most important aspect of deriving realistic measurement results is the emulation of traffic and load patterns during the measurement as they would occur in real applications. This leads to results that will reliably resemble the real QoS a user of the application would experience. It is not sufficient to just send a few packets to measure latency and to rate the transmission quality. The implemented test case is therefore designed to emulate real traffic patterns and to create data streams like in real-time applications. On the client-side, the sent traffic pattern – packet size and frequency – is set, and thus the data rate is controlled.
Real-time eGaming Traffic Pattern Example
In order to apply a realistic network traffic load, it is first necessary to define individual patterns as archetypes for different applications. The basic control parameters for such traffic patterns would include packet rate, packet size, packet delay budget (if exceeded, the packet counts as lost) and test duration. These parameters do not necessarily remain constant throughout a test; they can also emulate “bursty” shapes as are typical for applications with temporarily highly interactive phases.
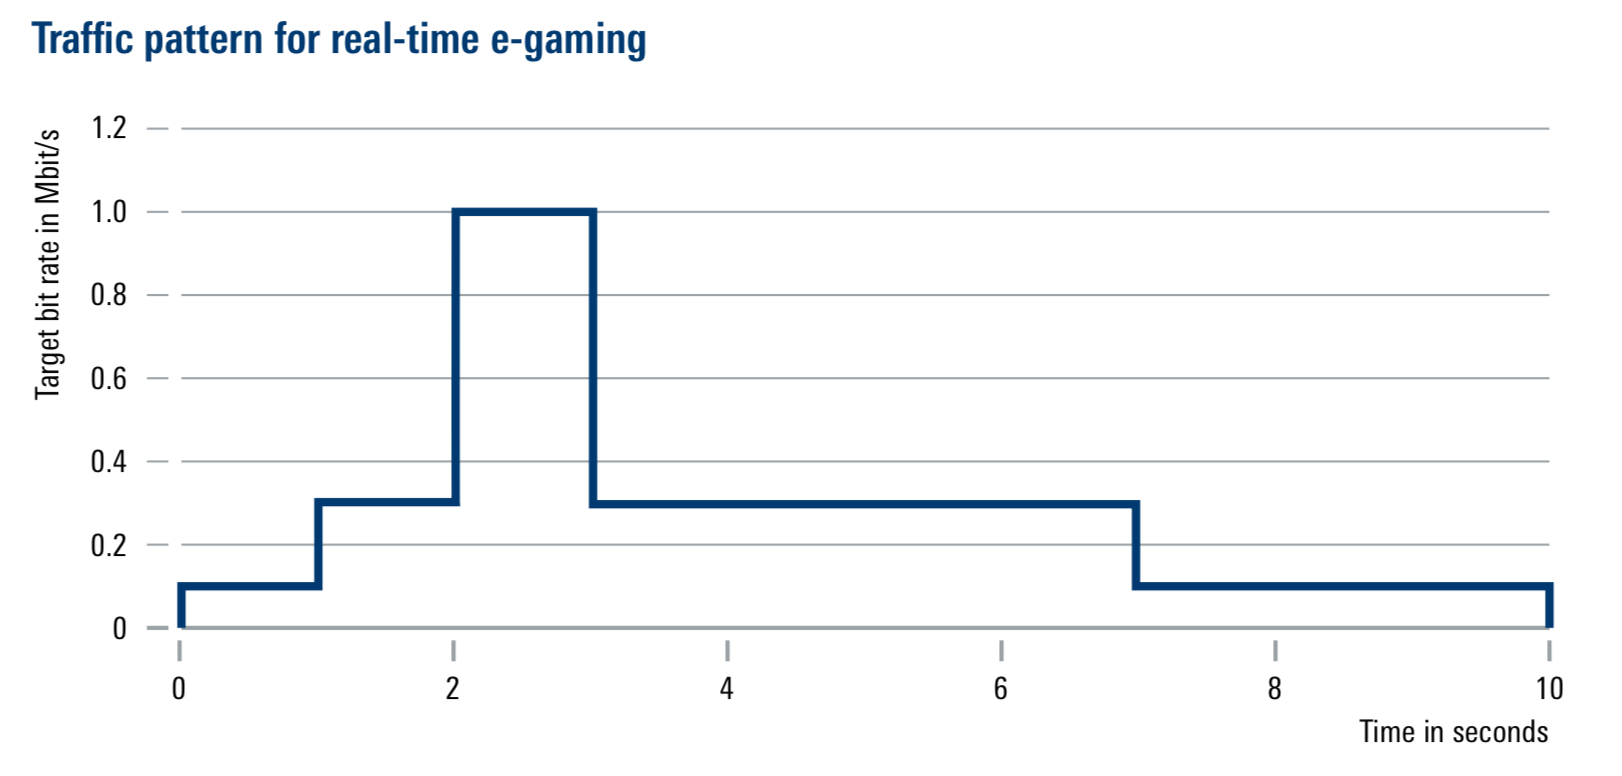
In a case study about the typical traffic patterns created by today’s most demanding real-time multiplayer online games from a network’s point of view, it was discovered that the mobile traffic is not constant but depends on the phase of a game. In normal phases, the data rate is relatively low, but it increases significantly when multiple players are active; short bursts of up to 1000 Kbit/s were measured. Based on this, the following traffic pattern has been defined as a challenging but realistic scenario for real-time eGaming applications, with an initial phase, a highly interactive phase, a sustainable phase and a trailing phase.

QoE Model – Interactivity Score
The QoE depends on the particular use case and the associated transport expectations and requirements. However, the underlying key performance indicators (KPI) and technical parameters are the same; the difference is how they are weighted in the QoE model. The technical KPIs of the interactivity test are as follows:
– Latency
– Packet delay variation (PDV)
– Packet error rate (PER)
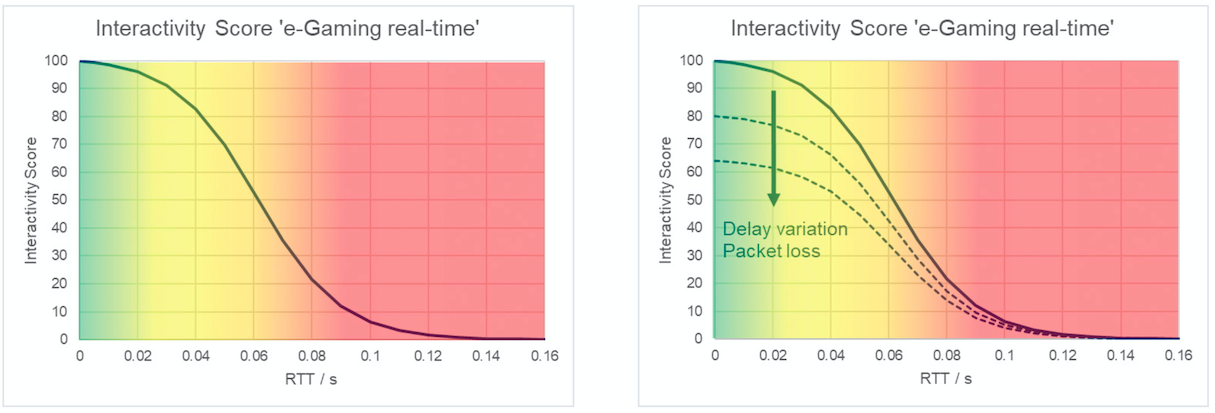
A QoE model was developed based on these three KPIs that targets today’s real-time eGaming applications, using the following interactivity score:
Interactivity Score = ScoreLATENCY × ScorePDV × ScorePER × 100%
The first term of the score is an s-shaped logistic function that maps the individual round-trip time measurements per packet to a pseudo perceptive scale. The remaining two terms depend on packet delay variation and packet error rate, whereby higher values lead to a downward shift of the s-curve. This is illustrated in the following figure.

The interactivity score is a generic and scalable model that is applicable to multiple human and non-human use cases.
To be continued in Part 2.

