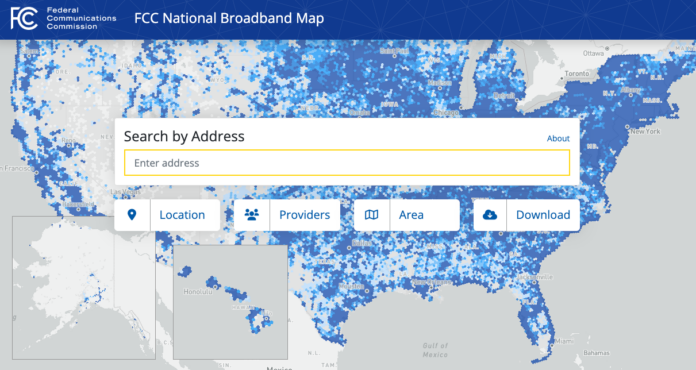
The newest version identifies another 330,000 locations unserved by broadband
The Federal Communications Commission has released an updated version of its National Broadband Map, one that FCC Chairwoman Jessica Rosenworcel said reflected a “big” step in a new, iterative process that is meant to provide a more accurate and up-to-date picture of broadband access across the United States.
This version of the map, as well as continued challenge-based refinements, will be used as the basis for state allocations from the massive Broadband Equity, Access, and Deployment (BEAD) funding program aimed at closing the digital divide, according to the National Telecommunications and Information Administration. The executive-branch agency added that it “is confident that with this data as a baseline, we will be able to effectively allocate [BEAD] funds by the end of June. We will continue to monitor the FCC’s updates to availability data to ensure that we make a well-informed allocation of these vital funds.”
The FCC released what it called its “pre-production” maps in late November of last year, offering unprecedented granularity at the address level of the availability of broadband services, from wireline options to satellite and both licensed and unlicensed Fixed Wireless Access—as opposed to the census-block level, which was the basis for previous mapping efforts. The census-block approach meant that if even one location within a census block had broadband service, the clock was considered “served”—which in many cases masked the fact that other people living in the same census block didn’t actually have access to a broadband service.
The new map’s first version, Rosenworcel said in a blog post, “was light years better than preceding maps because it no longer relied on census block-level reporting.” She said that the Commission has identified “over 114 million locations where fixed broadband could be installed compared to data from just 8.1 million census blocks in our prior maps.”
But that map was also a starting point for the challenge process, in which consumers and network providers could submit information that broadband access did (or didn’t) actually match the map. The new version “reflects these challenges, as well as other improvements to the data we have been making since we launched our first public effort last year. It has a lot of updated information about both locations and availability,” Rosenworcel said. She added that the FCC’s mapping team met with representatives from every state at least once and hosted more than 200 individual sessions with state, local and Tribal governments to help them understand how to submit and respond to challenges, and that the agency has implemented more stringent verification processes that “resulted in updates to over 600 submissions from providers and a clearer picture of broadband availability in every state and territory.”
She highlighted a number of statistics revealed by the new mapping information:
-More than 8.3 million homes and businesses across the country lack access to high-speed broadband.
-Challenges have been reviewed for more than 4 million locations and more than 75% of them have already been resolved.
-The new map version reflects a net increase of more than 1 million serviceable locations compared to the original version, and identifies nearly 330,000 more unserved locations.
In a separate blog post on its own analysis of the updates, NTIA noted that the net increase reflects the FCC adding about 3 million new Broadband Serviceable Locations and “removing nearly two million for reasons ranging from updated data to the use of sophisticated tools to identify and remove structures like garages and sheds.”
While those numbers may sound large, NTIA concluded that “the overall national story remains consistent: From version 1 to version 2 of the FCC’s map, the percentage of unserved locations nationwide increased by 0.2 percentage points.”
Rosenworcel said that the Commission’s mapping team has been making minor updates “regularly for most of 2023” and that major updates will come at a cadence of twice a year as the agency incorporates the results of challenge outcomes and accepts more challenges to help improve the map.

