
February greetings from Boston (pictured), Iowa, and Missouri. The last two weeks have been filled with earnings releases, economic reports, and general news. We will do our best to cover the most salient parts of the past fortnight in 2,200 words or less.
Specifically, we will focus on whether the proof points we described in the previous two Briefs were met. Not surprisingly, it’s a mixed bag, and each of the telecom carriers has a list of action items for 2025.
If you have not ordered Dan Caruso’s book Bandwidth: The Untold Story of Ambition, Deception, and Innovation That Shaped the Internet Age and Dot-Com Boom on Amazon (here) or your favorite bookstore, please consider doing so today. We were fortunate enough to get our hard (500+ page) copy this week, as well as the Audible version. For those of us who were participating in the bandwidth boom/ bust, it brings back memories. We think it will be especially insightful and inspirational, however, for younger telecom professionals. We are about a quarter through it and the book is informative – full review to follow.
The fortnight that was

Note: End-of-year share counts are very close to what will be reported after all of the 10-K reports are issued. All other information has been updated and will be posted on the Feb 15-16 interim Brief.
What a difference a fortnight makes. DeepSeek was not on most of our radar screens on January 26th (the last Brief), but then we awoke on January 27th to a serious competitor to Chat GPT and other AI startups. Then we had Fab Five earnings, which were OK but (except for Facebook) did not significantly exceed expectations. As we have said with other market selloffs, context is important. Microsoft (one of the principal owners of Open AI) at $410/ share is all the way back to early November 2024 price levels. Amazon and Apple haven’t seen these lows since mid-January (2025), and Alphabet/ Google levels were last seen in mid-December (2024). Meta/ Facebook set an all-time high on Friday.
Since then, we have averted a trade war with Canada and Mexico (but not China), had a decent jobs report (but for the significant revisions which are benchmarked to March 2024 – and more revisions to come), and appear to be headed to 75,000-100,000 government employees accepting a buyout.
The economy, despite the short-term news, appears to be resilient: the Atlanta Federal Reserve sees 2.9% growth for Q1 2025, about 20% more than most Blue-Chip economists. More growth and 4% unemployment are terrific for most industries tied to monthly revenues (like telecom), but not great for bond yields and inflation prospects. The net of all these changes (including quarterly earnings reports which we will look at below) is a mere $40 billion (0.3%) year-to-date decrease in the value of the Fab Five and a $30 billion (3-4%) increase in the value of the Telco Top Five. After all of the news, not much changed.
One of the principal reasons why the Fab Five are holding up is that each of them has more cash and other liquidity than debt (a.k.a, negative net debt). Here are the levels at the end of 2024 (comparisons to Sept 30 2024 and the end of 2023 are also shown – full details are in the spreadsheet to be distributed in next week’s interim Brief):
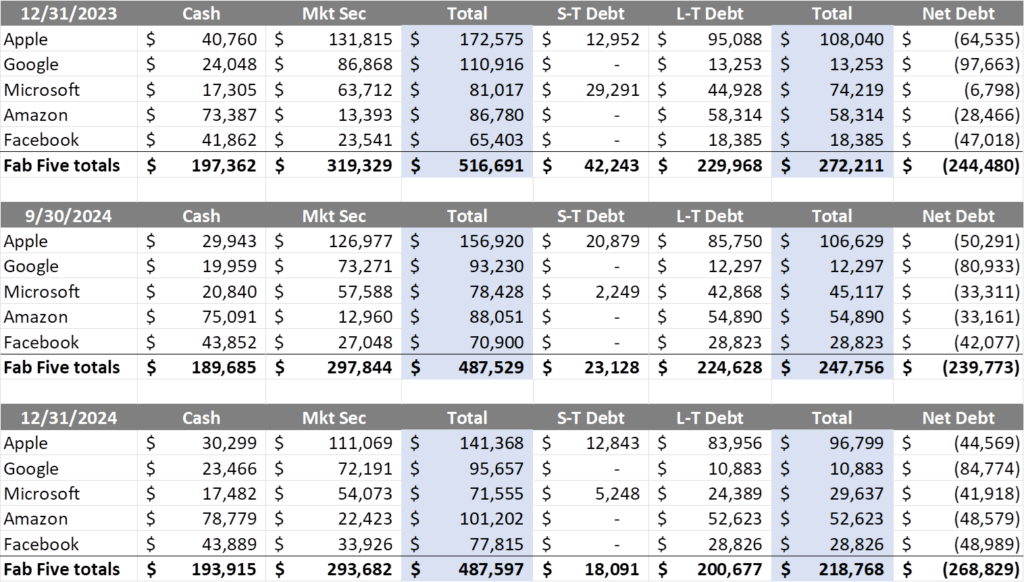
In aggregate, cash on hand for the Fab Five was remarkably stable on a quarter-to-quarter basis with Amazon and Meta/ Facebook picking up (Holiday) cash and Apple dipping into their reserves to promote the Apple iPhone 16 and Apple Intelligence. Microsoft, who was closing the acquisition of Activision Blizzard at the end of 2023, managed to bring their net debt levels back to -$42 billion in twelve months. Both Amazon and Microsoft’s gains offset Apple’s decreases in negative net debt to grow the total for the group by $24 billion.
While year-over-year net debt remained relatively stable, Microsoft still spent $60+ billion in capital expenditures in 2024, a number comparable to both Amazon ($83 billion) and Alphabet/ Google ($53 billion). These three companies plus Meta accounted for more than $230 billion in capital spending last year, with much of that in the United States. This dwarfs telecom spending for 2024 (likely in the $70-80 billion range for the Telco Top Five).
For 2025, Fab Five spending will grow by 35-40% from 2024’s elevated levels: Amazon at $100 billion, Microsoft at $80 billion, Google at $75 billion and Meta at $65 billion. This spending will focus on data center (big and small) capacities to fuel the growth of AI. Add in Stargate (assuming some double counting with Microsoft), and spending could easily top $400 billion in 2025, nearly 10x the size of BEAD funding. It’s a great time to be in the trades including generators, power panels, and (Jim’s current company, CellSite Solutions) shelters and other large enclosures.
Q4 earnings review—did they prove it?
We spent the previous two Briefs looking at what each company needed to prove to assure investors of their current value. They were as follows:
- For Verizon: That Prepaid Consumer subscribers and profits could stabilize;
- For AT&T: That they could achieve a 50% fiber share in more mature markets;
- For T-Mobile: That they could provide signs that they can lower postpaid phone churn;
- For Comcast: That they would finally show that they could materially grow wireless subscribers at least as fast as Charter/ Spectrum;
- For Charter: That they could retain their customer base (specifically broadband and video).
Here are two we think were at least partially proven:
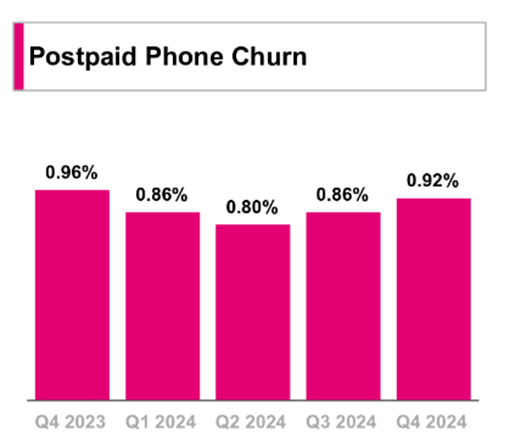
- T-Mobile posted one of the lowest 4Q postpaid phone churn rates in the history of the company (matching 4Q 2022 levels) even with lower gross additions. Nearby is the chart from their Fact Book. It helped them post a similar level of postpaid phone net additions for the quarter (905K in 4Q 2024 vs 934K for 4Q 2023, and 927K for 4Q 2022). While Verizon’s postpaid phone net additions increased 26%, it was from a small number and T-Mobile’s level was nearly equal to the sum of their two smaller rivals (Verizon 568K + AT&T 482K = 1.05 million vs. T-Mobile’s 905K, a 46% share of “Big 3” decisions). We will know more about the source of Verizon’s postpaid net phone growth when their 10-K is released but believe that a larger share (than 2023) came from prepaid to postpaid conversions. From our read of their 10K and earnings packages, it does not appear that T-Mobile had any material prepaid to postpaid conversions.
- Charter’s ACP and storm-adjusted subscriber losses were less than most analysts expected, and one of the reasons why their market cap has grown since the beginning of 2025 (vs. an 8% decline for Comcast). Jessica Fischer, Charter’s CFO, led her section of the earnings presentation with the following slide:
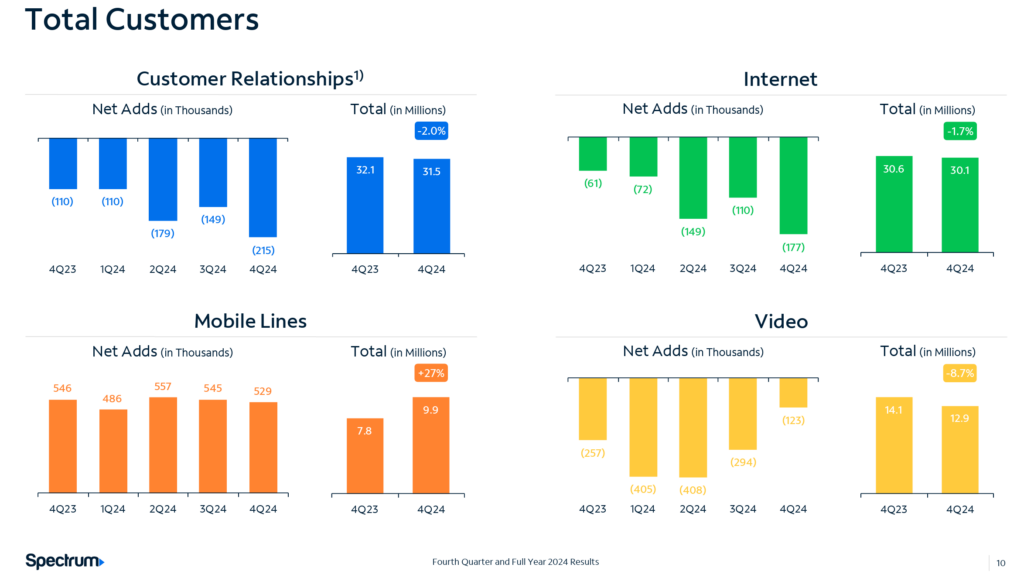
As a comparison, Comcast decreased total customer relationships by 1.5% in 2024, broadband by 1.3% and video by 11.2%. Both companies had Affordable Connectivity Plan losses (Charter announced 140,000 AVP-related broadband losses in addition to 20,000 disconnects related to two hurricanes – roughly 75% of the 215K loss shown in the above chart), and both face competition from fixed wireless and new fiber builds (AT&T being the largest). The stemming of video losses was the most surprising figure: Comcast lost 311K subscribers on a beginning of quarter base of 12.834 million customers (2.4%), vs. a < 1% base loss for Charter (123K loss on a beginning of quarter base of 13.015 million).
We attribute this to Charter’s innovative approach to current video customers and believe that Comcast would benefit to more aggressively adopt it (as well as Charter’s Xumo strategy). The expectation was set on the Charter call that they would be close to “net zero” additions by the first quarter. The company’s rural broadband initiative should contribute to that objective (we estimate that it could add an additional 40-50K customer relationships, all of which carry broadband).
As for Verizon, AT&T and Comcast, here are our perspectives on their proof points:
- Verizon maintained their retail + wholesale consumer growth, but prepaid stabilization has not been proven yet (and a tax refund-driven Q1 could prove to be a false positive). Here’s an eight-quarter view of subscriber growth for retail postpaid including MVNO additions. All-time highs are highlighted in green. Note the last row which tracks the prepaid subscriber base:
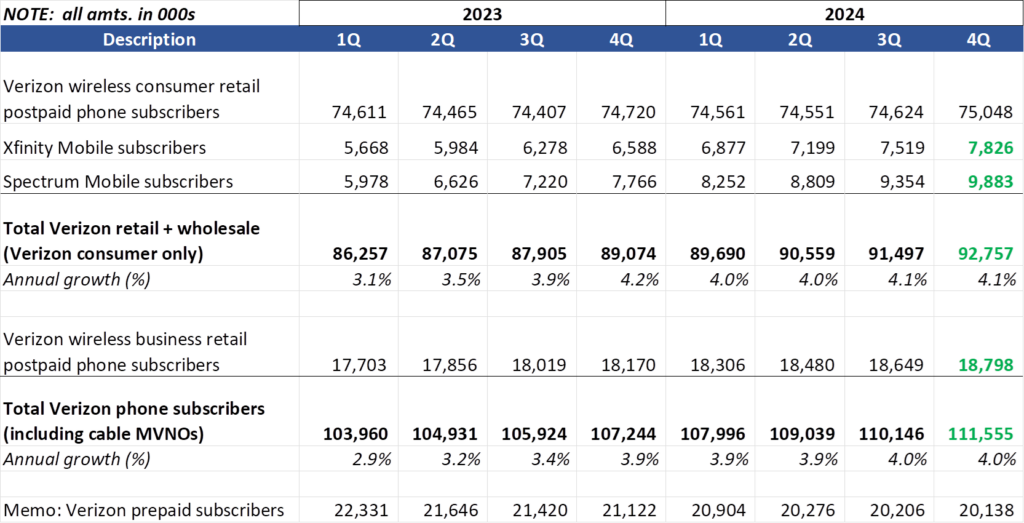
Verizon had grown their consumer wholesale+retail base by more than 4% (a high percentage of the MVNO additions are phones, but it’s safe to say that Big Red is growing in the “upper 3s” led by cable MVNO growth). Business postpaid phone subscribers are also growing at very strong rates (3.5% annually). Verizon’s consumer postpaid phone base is within one half of 1% of their 3Q 2021 high (75.388 million subscribers). When it comes to postpaid, with or without MVNO, Verizon is at worst case flat and growing in most areas.
Then there’s consumer prepaid, which, thanks to ACP-related losses, is now clinging to a 20 million base, more than 3.7 million (15.5%) lower than the day they closed the Tracfone transaction. Given the company’s investments into Visible and Total Wireless brands, investors expect (a lot) more growth to justify the original Tracfone purchase price.
Postpaid looks better (albeit with very strong promotions). The verdict on prepaid is still out.
- AT&T had great results but was silent on 50% share proof points. As we mentioned in the interim Brief, Ma Bell’s results were strong enough to propel AT&T’s market capitalization ahead of Verizon’s. Here’s the latest trend chart for AT&T consumer wireline:
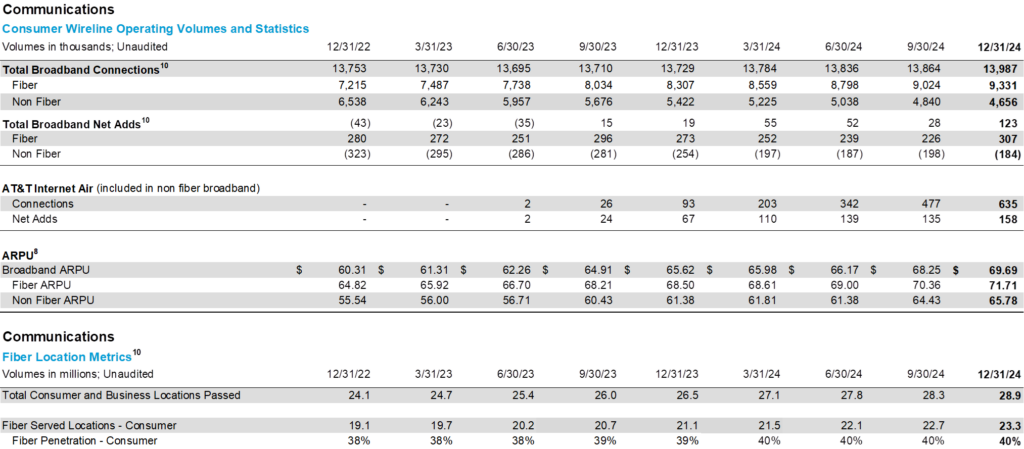
Fiber broadband net additions eclipsed 300K, driven by catchup work from a labor strike in 3Q but still impressive. Throughout 2024, however, the total base never eclipsed 40% (and only increased by tenths of percentages per quarter). At this pace, AT&T might grow 1-1.5% points on the base annually, leading to a 50% overall base by 2033-35. We don’t think that’s what they meant by “long-term” at their capital markets day. And it’s highly likely that Charter and Comcast will respond with a competitive hi-split or DOCSIS product which could impact share gains even further.
The company should provide examples (maybe driven by the average age of fiber deployment(s) in the market) where they have achieved a 50% share. We think there should be several to choose from. We do think that an integrated Internet Air + AT&T Fiber strategy could grow well above 40% share, but it will require higher “street by street” marketing spend and believe that the best opportunity to achieve disproportionate share gains is in the next 6-8 quarters.
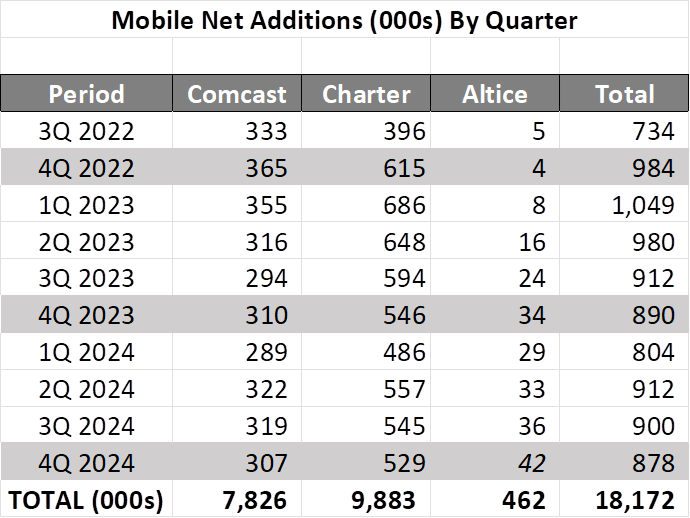
- Comcast was not very serious about wireless in Q4 but indicated on their earnings call that their “intention to push harder.” Nearby is our publicly traded cable company mobile net additions tracker using the last 10 quarters (the full chart of net additions from the beginning is in the spreadsheet we will distribute with the interim Brief next week).
The pattern and difference vs Spectrum (against a background of lower gross additions for the year) is not that different from 2023 or 2022. Charter bested Comcast by 250K net additions in 4Q 2022, 236K in 4Q 2023 and 222K net additions in 4Q 2024. For the full year, on roughly the same broadband base, Charter grew 800K more net additions than Comcast in 2024 and by 2 million since the beginning of 2023.
Charter was specifically referenced by Comcast President Mike Cavanaugh on their call (transcript here):
“…we’ve been at it [wireless] for a few years, and I think we like what we see, and our intention is to push harder. We’ve seen Charter try some things that we have watched and seen what they’re doing. So I think pushing for more simplified bundles.”
This comment, combined with another about the reduction of competitors from four to three (which occurred five years ago almost to the day– see here) really left us asking “Why is it taking Comcast so long to get serious about wireless and will their delay hasten broadband declines, especially in Florida and major metros like Chicago, San Francisco, and Houston where AT&T is expanding their footprint? What are they waiting for?”
Bottom line: Fourth quarter earnings were OK for telecom. Business wireline still stinks for AT&T and Verizon (but great for Comcast Business), and there were glimmers of hope for a Verizon consumer turnaround. But T-Mobile and Charter were the only two to demonstrate their proof points, and, unsurprisingly, they are driving the overall telecom and cable market capitalization gains.
That’s it for this week. The next Brief will continue with earnings thoughts and likely include a review of Dan Caruso’s new book. Until then, if you have friends who would like to be on the email distribution, please have them send an email to sundaybrief@gmail.com and we will include them on the list (or they can sign up directly through the website).
Finally – go Davidson College Basketball and the Super Bowl champion Kansas City Chiefs!
Important disclosure: The opinions expressed in The Sunday Brief are those of Jim Patterson and Patterson Advisory Group, LLC, and do not reflect those of CellSite Solutions, LLC, or Fort Point Capital.

