AT&T and Verizon pick up some steam, while T-Mobile makes adjustment in wholesale numbers
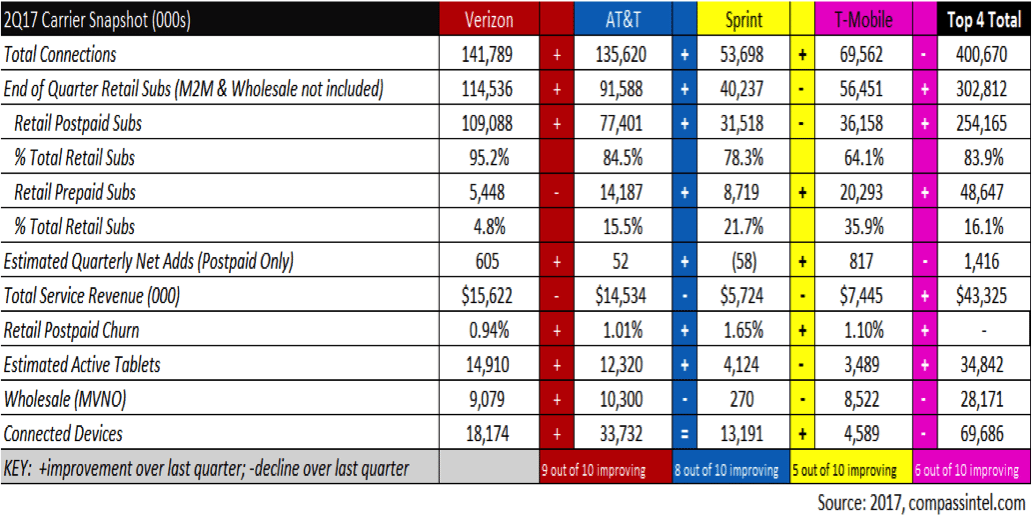
It is that time when we reflect on the carriers’ results for Q2. Compass Intelligence just completed the final assessment of Q2 2017 and also compared this quarter’s results to those from Q2 2016. We do this each quarter to understand the subscriber and share changes, as well as evaluate the key trends taking place in the wireless industry for both consumer and B2B. We have been tracking the quarterly metrics since 2007, and have extensive models in B2B, market share, share of gross adds, and other deep dive analysis. Some metrics are our own internal modeling and estimates, as the market does not report in all categories. A snapshot of Q2 2017 is below.
Compass Intelligence compared last quarter’s results to this quarter to show which metrics showed improvement over others (denoted by + or -).
Below are additional thoughts and insights based on the quarter and comparison to Q2 2016:
Summary:
• The U.S. wireless carrier market continues to experience volatility overall, as quarter to quarter we are jumping from net positive additions to net negative additions in overall connections.
• Verizon experienced 9 out of 10 improvements from Q1 to Q2 2017, with AT&T improving 8 out of the 10 metrics.
• This quarter saw fair improvements from the 2 largest carriers, AT&T and Verizon, yet T-Mobile continued to dominate in total postpaid net adds. The quarter ended with 412.4 million total connections (including mobile and IoT).
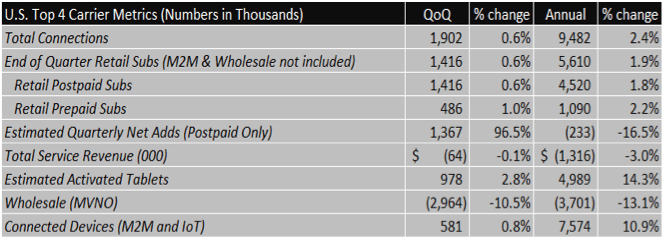
• Q2 2017 experienced a drop in total connections across the 4 carriers with a decline of about 480,000 overall (Note: T-Mobile made a decision to remove Lifeline subscribers from its wholesale connections, so without this change, overall connections would be growing).
• Retail subscribers for the top 4 carriers climbed to 302.8 million or an addition of 1.9 million added for the quarter.
• While Verizon maintained the lowest churn for the year at an average of 0.94%, all 4 carriers improved their churn rates, meaning their churn percentage decreased from the previous quarter.
• The market reached a total of 34.8 million tablets ending Q2 2017, with Verizon adding an overall 507,000 just in Q2 2017 alone.
• REVENUE: Similar to last quarter, the top 4 carriers reported lower service revenue quarter-on-quarter except for T-Mobile.
• T-Mobile increased revenue in Q2 2017 by $116 million compared to Q2 2017.
• Combined the industry experienced a total of $43.3 million this quarter, with revenue remaining fairly flat from the previous quarter.
• Over the last 4 quarters, the top 4 carriers have experienced a 3.04% decline in wireless service revenues.
• POSTPAID ADDS:
• All 4 carriers ended the quarter with positive postpaid net adds with the exception of Sprint, adding 1.4M retail subscribers for the quarter.
• T-Mobile dominated with postpaid adds, representing 58% of the total postpaid net adds added across the total market.
• Verizon added 605,000 postpaid subscribers in Q2 2017 which is an improvement from last quarter.
• CONNECTIONS:
• Total industry connections reached 400.7 million at the end of Q2 2017 for the top 4 carriers
• Total industry subscriber base: 412.4 million (Includes ALL MNOs and MVNOs, includes IoT/M2M)
• Total smartphone subscribers=331.0 million
• Total Connected Devices reached 67.8 million for the industry.


