As the headline suggests, this analysis should be seen in context. It offers only rapid arithmetic around the World Economic Forum’s (expanding) list of ‘lighthouse’ factories, which claim the most success with digital change. It considers the available data (the location and ownership of factories) from this research, and crosses the results with wider economic performance. Nevertheless, its conclusions are telling.
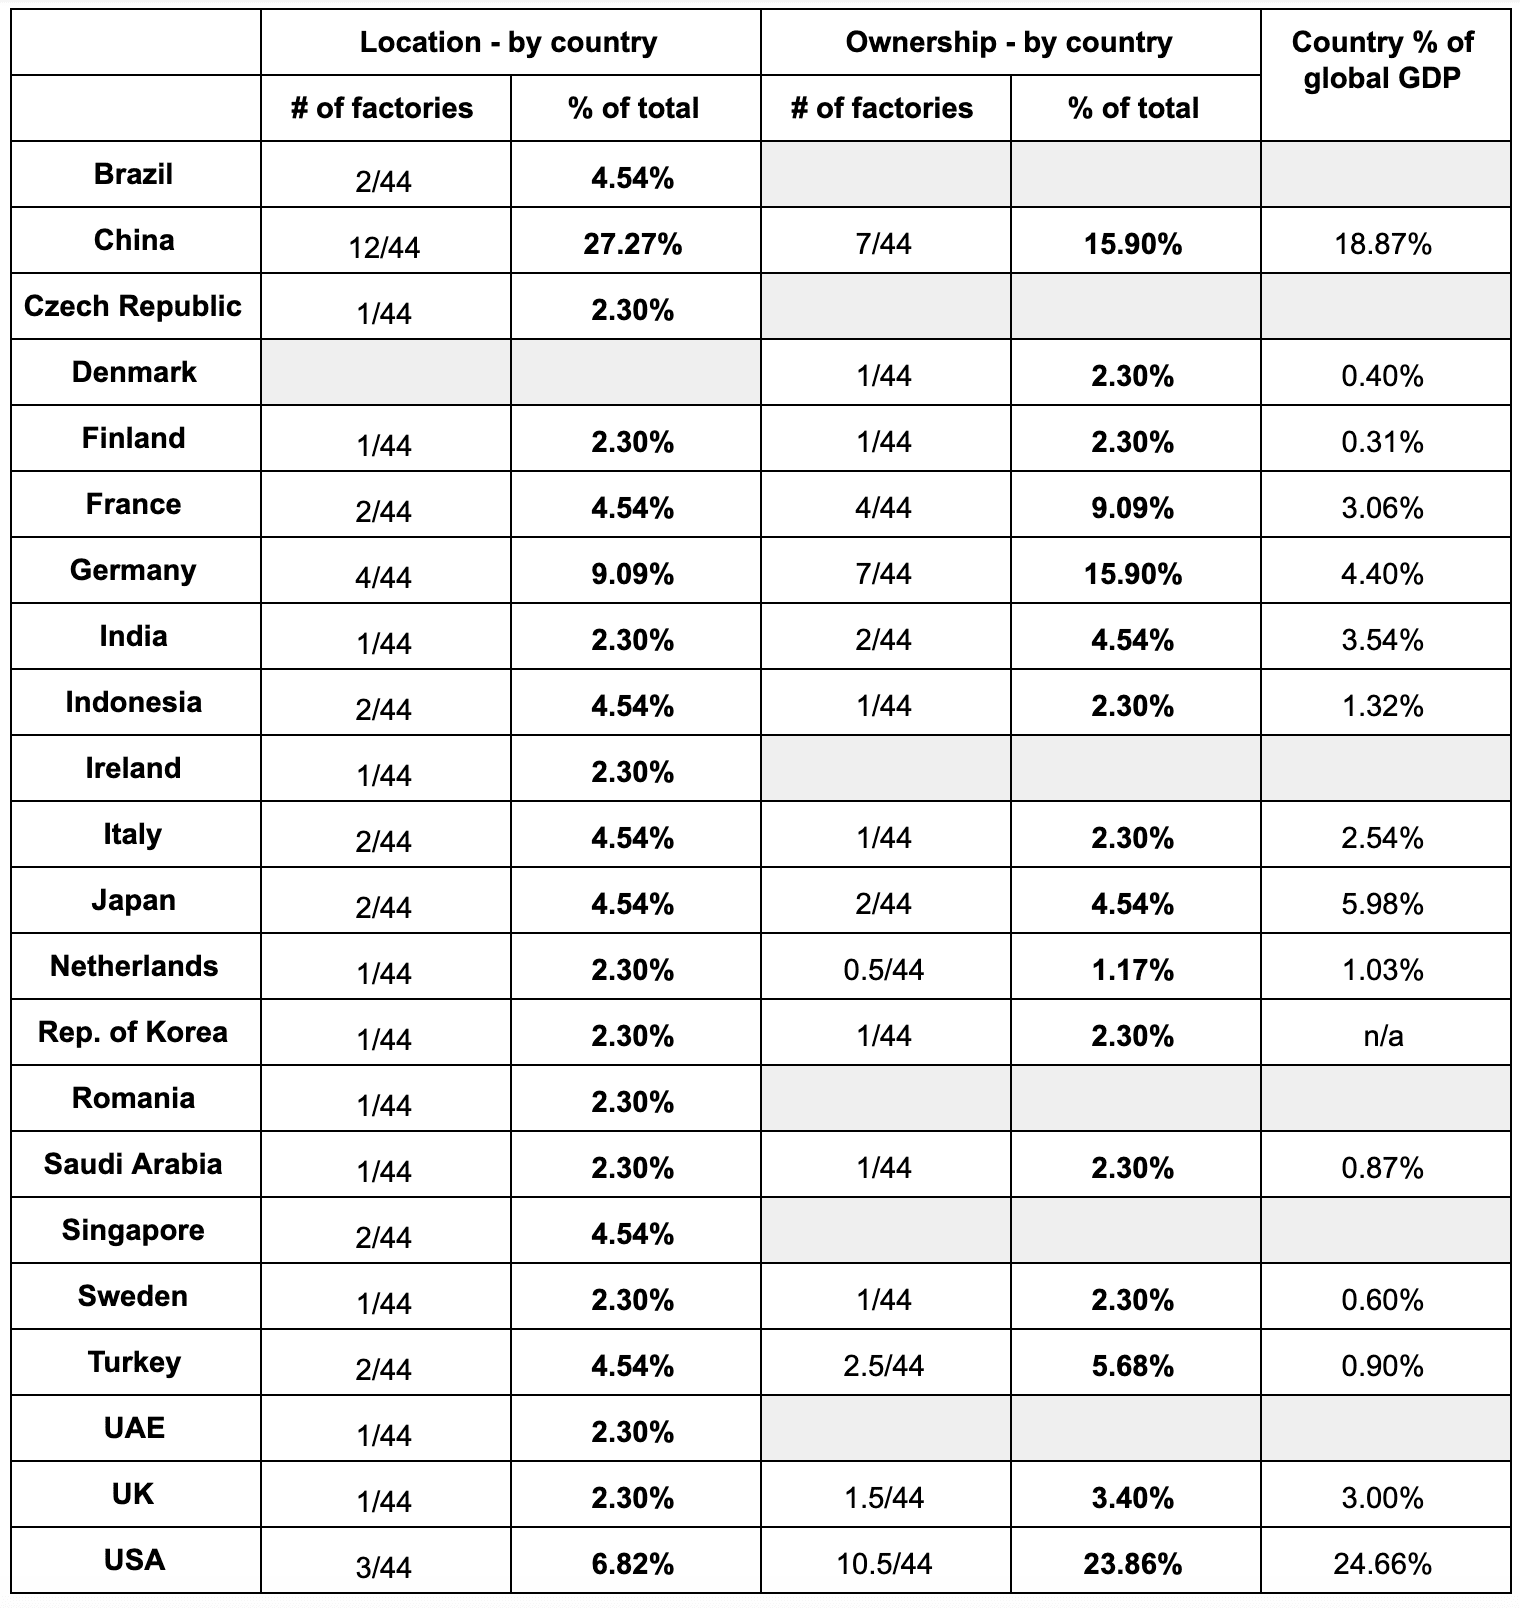
The US is under-performing, woefully, in the digital upgrade of its industrial sector, compared with rival economic powers, if the number of top-ranked ‘smart factories’ in the country is anything to go by. Only three US-based factories are ranked on the World Economic Forum’s leaderboard of ‘lighthouse factories’ (see chart, bottom of page), supposedly showing the way with digital change.
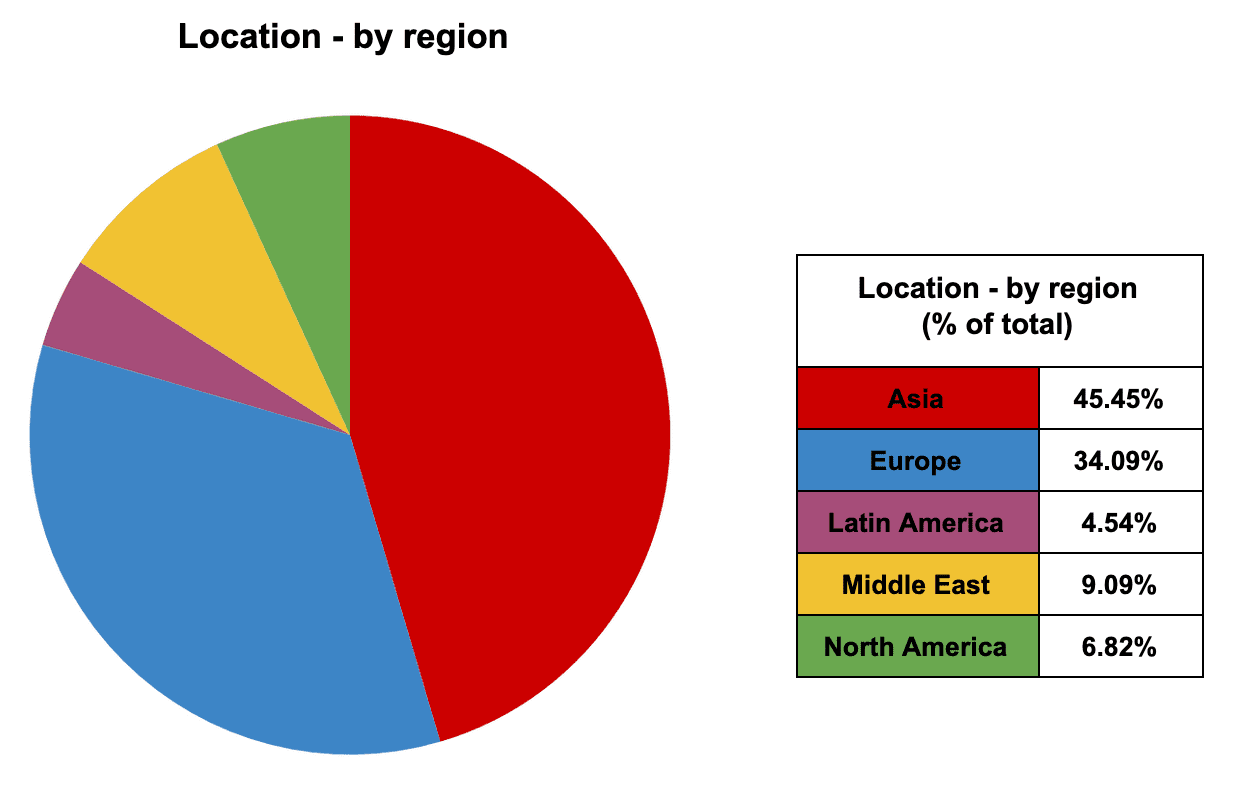
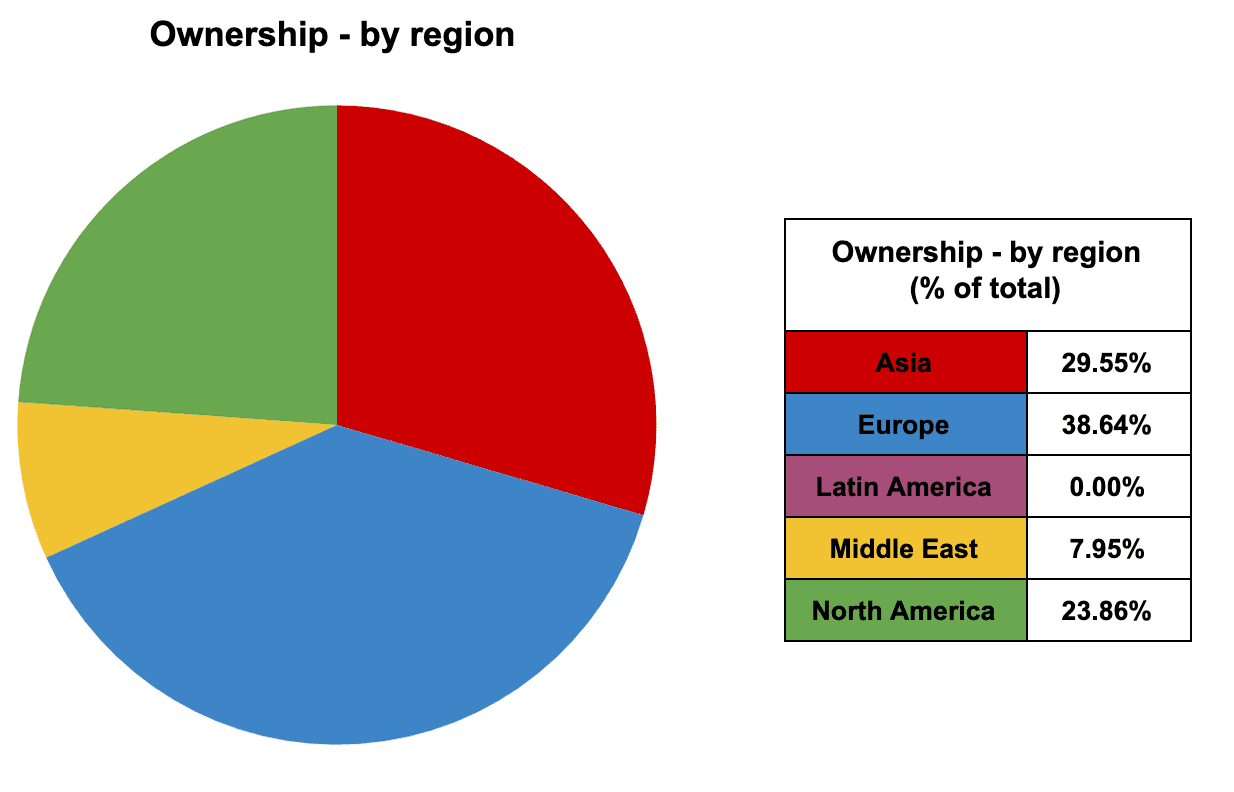
In fact, North America as a whole is under-indexing. Only three out of 44 lighthouse factories are from North America (see two charts below); all of them are US-based. Canada and Mexico, its regional compatriots, do not feature at all. By comparison, Asia and Europe register 20 times and 15 times, respectively, on the list, which was compiled for the World Economic Forum by McKinsey & Company.
 It might be argued the US fares better when pitted against country rivals. Only two top-rated factories are in France and Japan, each (see bottom); Germany, first home of the Industrie 4.0 movement, is home to only four. But the US contributes a quarter (24.66 per cent) of global GDP (based on IMF figures), where these countries are variously responsible for three-to-six per cent, each.
China, as per the trade war dominating the political agenda, is a better comparison. China is home to a dozen of the smartest factories in the reckoning. Its share of global GDP is 18.87 per cent; its share of the smartest smart factories, supposed to drive efficiency and productivity, is higher, at 27.27 per cent.

We might compare the US leadership-share (conflated with the North American share, if preferred) against the relative positions of Europe and Asia, more generally. Asia’s count of 20 and Europe’s of 15, both out of 44 factories, represent shares of almost a half (45.45 per cent) and a little over a third (34.09 per cent)l; their regional contributions to global GDP stand at a third (33.8 per cent) and a quarter (24.26 per cent), respectively.
Both regions, then, over-index in terms of their industrial-digital leadership, if GDP is taken as a yardstick for industrial power. If – and, of course, it is a big if – the McKinsey & Company study is somewhat representative of the new digital prowess within each region’s, and each country’s, industrial sectors, then they will surely close ground.
But – and this is an important but – this is just one aspect of this Industry 4.0 leadership club. Production follows labour, often away from home. The question about leadership in the Industry 4.0 space might be better squared with ownership of the factories, rather than just their location. After all, who drives digital change? Staff, in the factory, or management, in the board room?

Here, considering membership of the club again, the US places better (see top, and left). Almost a quarter (23.86 per cent) of the 44 factories are owned by US firms, which more closely reflects both the North American and US shares of global GDP (28.24 per cent and 24.66 per cent, respectively). But it is less, as a relative share, even so.
That said, the performance of Asia (which for simplicity combines south, southeast, and east-Pacific regions on both scores) also falls away when its factory-ownership share is compared with its GDP contribution – as 29.55 per cent and 33.8 per cent.
Europe, by contrast, is gunning its industrial engines, it seems. Almost two in five (38.64 per cent of) factories on the McKinsey & Company list are European-owned (again, the region is contributing around a quarter-share to global GDP).
Country break-out figures in Europe are interesting, too. They appear to confirm Germany and France are driving the industrial-change agenda (their factory-ownership shares at least tripling their global-GDP shares), while Italy and the UK, the other major European economic powers, are boxing their GDP weights, only, in terms of smart factory-ownership.
But, while it is interesting as a comparative metric, GDP is not a measure just of industrial productivity. Like we said at the top of the page, this is imperfect analysis. GDP considers other exports, notably financial services, plus everything besides, including private spending, government purchases, and business investments. It is right and proper, therefore, that France and Germany, the biggest industrial markets in Europe, and the biggest contributors in Europe on the McKinsey list, post relatively higher digital-change shares versus their GDP shares.
Other findings may be considered in this context, too.
Note, the World Economic Forum’s lighthouse factories have built up from an original cohort of nine, in September 2018, with seven added in January last year, a further 10 last summer, and 18 added this month (January 2020). Details about all 44 factories can be found at the preceding links.


